![]()
The topics of this section cover the Report Designer features that don't fall into other categories.
This section consists of the following topics.
This document describes the basic principles of scripting, which can be performed by handling the events of a report, and its bands and controls.
This documents consists of the following sections.
Scripting Overview
Scripting Specifics
Example: Custom Summary
Scripting Overview
Scripts are program commands, placed within the event handlers of the required report elements. And, when the corresponding event occurs (e.g. a mouse click), the script code runs.
You can write scripts for a report or any of its elements (bands and controls), to be executed when the report is being previewed, printed or exported.
Although when in the Report Designer, virtually any task can be accomplished without scripting (Conditionally Change a Control's Appearance, Conditionally Change a Label's Text and Conditionally Hide Bands), scripting is made available to extend the standard functionality as far as may be required. And, scripting is the only way to calculate custom summaries (this is detailed in the last section of this document).
Every report element has an set of script events, which are individual for each element's type. For example, the events of the Detail band are shown in the following image.
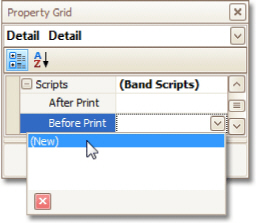
After you click (New) for an event (e.g. the Before Print, which is the most used), the Scripts Tab is switched on, where you can manage and edit all the report's scripts.
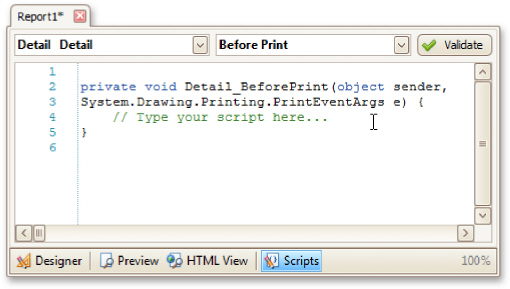
In this tab, for a selected event, a script template is auto-added, in the language specified via the Script Language property of the report.
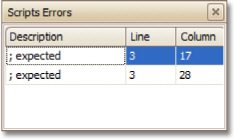
You can verify that your report's scripts are valid, by clicking Validate. The validation result is then displayed in the Scripts Errors Panel.
Note that scripts are saved to a file along with the report's layout (for details on this, refer to Back Up the Current Layout Before Modifying It).
Scripting Specifics
1.Scripting language
The report scripts may be written in one of the following languages that the .NET framework supports - C#, Visual Basic and J#. Since J# is not installed with the framework installation, by default, make sure it is present before writing code in it. The scripting language is specified via the Script Language
property of the Report object. It is set to C#, by default.
2.Scripting scope
Script execution is performed in the following way:
The report engine generates a temporary class in memory. The names of the variables are defined by the Name properties of the controls and objects they represent. When the script is preprocessed, its namespace directives are cut from the script code and added to the namespace, where the temporary class is defined.
After preprocessing, all scripts are placed in the code of the temporary class. Then, the resulting class is compiled in memory, and its methods are called when events occur.
Scripting offers many advantages: you can declare classes (they will become inner classes), variables, methods, etc. A variable declared in one script is accessible in another script, because it is, in fact, a variable of the temporary class.
3.Reference External Assemblies
The Script References property of the Report object specifies the full paths (including the file names) to the assemblies that are referenced in the scripts used in a report. These paths should be specified for all the assemblies that are included in scripts via the using (C#), Imports (Visual Basic) or import (J#) directives.
![]() Note
Note
Usually, you don't need include any assembles, because most standard assemblies that you may require in scripts are already referenced by the Report Designer.
Example: Custom Summary
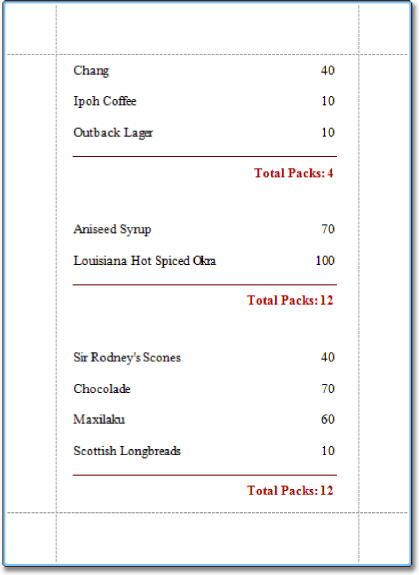
In this example, we will display the total number of product unit packs in a group.
To perform this, execute steps similar to the ones described in Add Totals to a Report, except that for the summary field, you should set the Function property to Custom.
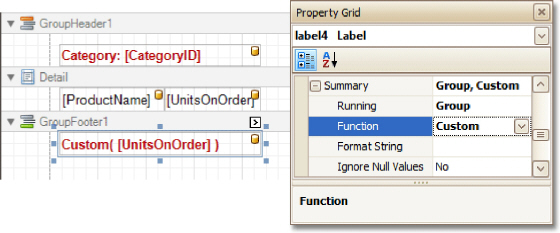
Then, the additional events are added to the label's Scripts property.
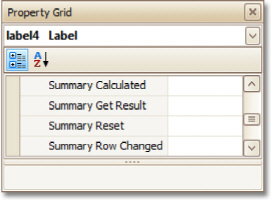
You can handle these events in the following way.
|
C# |
// Declare a summary and a pack.
double totalUnits = 0;
double pack = 15;
private void OnSummaryReset(object sender, System.EventArgs e) { // Reset the result each time a group is printed.
totalUnits = 0;
}
private void OnSummaryRowChanged(object sender, System.EventArgs e) {
// Calculate a summary.
totalUnits += Convert.ToDouble(GetCurrentColumnValue("UnitsOnOrder"));
}
private void OnSummaryGetResult(object sender,
DevExpress.XtraReports.UI.SummaryGetResultEventArgs e) { // Round the result, so that a pack will be taken into account
// even if it contains only one unit.
e.Result = Math.Ceiling(totalUnits / pack);
e.Handled = true;
}
|
Visual Basic |
' Declare a summary and a pack.
Private totalUnits As Double = 0
Private pack As Double = 15
Private Sub OnSummaryReset(ByVal sender As Object, ByVal e As System.EventArgs) ' Reset the result each time a group is printed.
totalUnits = 0
End Sub
Private Sub OnSummaryRowChanged(ByVal sender As Object, ByVal e As System.EventArgs) ' Calculate a summary.
totalUnits += Convert.ToDouble(GetCurrentColumnValue("UnitsOnOrder"))
End Sub
Private Sub OnSummaryGetResult(ByVal sender As Object, _
ByVal e As DevExpress.XtraReports.UI.SummaryGetResultEventArgs)
' Round the result, so that a pack will be taken into account
' even if it contains only one unit.
e.Result = Math.Ceiling(totalUnits / pack)
e.Handled = True
End Sub
Finally, switch to the Preview Tab, and view the result.
See Also
Count the Number of Records in a Report or a Group
Cancel Printing If a Report Does Not Contain Any Records
Limit the Number of Records per Page
This document describes how to accompany every record in a data-bound report with its current row index.
To show the current row index in a report, use a Label control bound to a data field, and specify its Summary options in the following way.
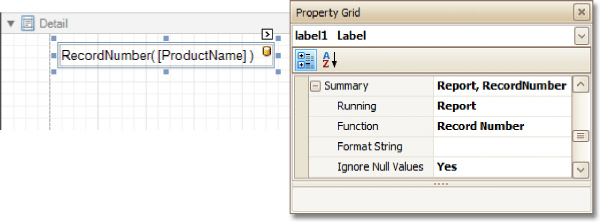
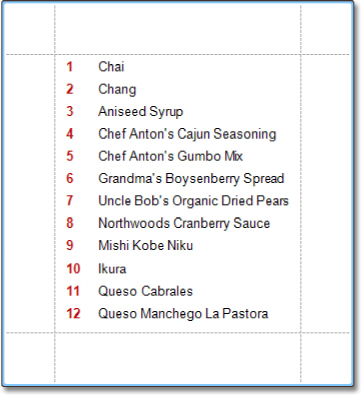
The result is shown in the following image.
See Also
Count the Number of Records in a Report or a Group
Limit the Number of Records per Page
Cancel Printing If a Report Does Not Contain Any Records
Count the Number of Records in a Report or a Group
This tutorial describes how to count the number of records in a report or a group. To demonstrate this feature, we'll use a report with grouping, similar the one created in the following tutorial: Change or Apply Data Grouping to a Report.
This tutorial consists of the following sections.
Count the Number of Records in a Group
Count the Number of Records in a Report
Get the Result
Count the Number of Records in a Group
To count the number of records in a group, do the following.
Select the Label in the Group Footer area, and in the Property Grid, expand its Summary category.
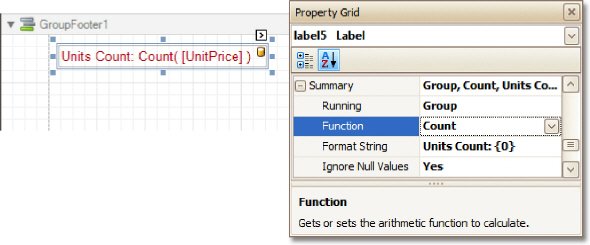
Set the Running option to Group and the Function to Count.
The Ignore NULL values option is useful for functions like Count or Average, because the number of elements counted will depend on it.
If required, you can specify the Format String (e.g. as Units Count: {0}). Note that value formatting is applied to a summary independently of the general formatting, and has a greater priority.
Count the Number of Records in a Report
To count the number of records in a report, do the following.
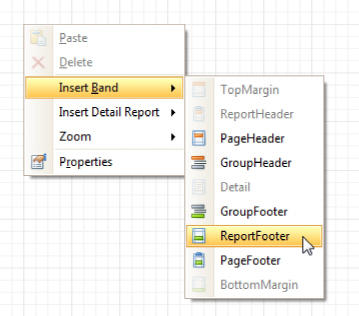
1.To add a Report Footer band to your report, right-click anywhere on it, and in the invoked Context Menu , choose Insert Band | ReportFooter.
2.Then, place a Label bound to a data field onto it, and in the Property Grid, expand its Summary category.
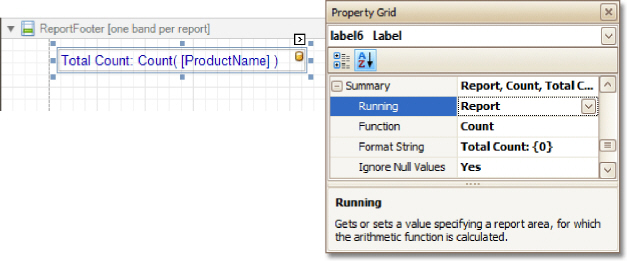
Set the Running option to Report and Function to Count.
The Ignore NULL values option is useful for functions like Count or Average, because the number of elements counted will depend on it.
If required, you can specify the Format String (e.g. as Total Count: {0}). Note that value formatting is applied to a summary independently of the general formatting, and has a greater priority.
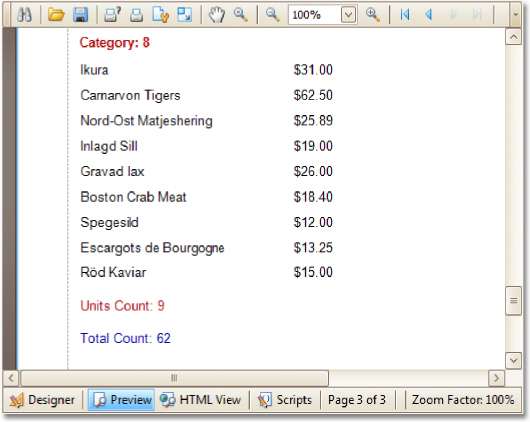
Get the Result
The report is now ready. Switch to the Preview Tab, and view the result.
See Also
Limit the Number of Records per Page
Cancel Printing If a Report Does Not Contain Any Records
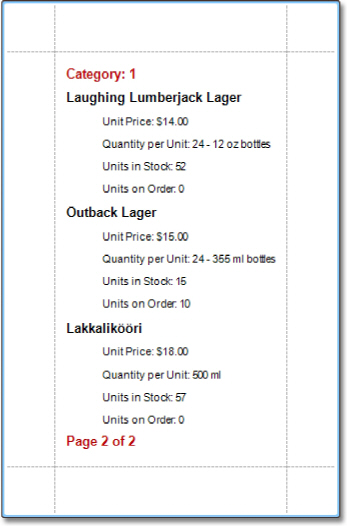
This tutorial demonstrates how to display page numbers individually, for each group in your report. To demonstrate this feature, we'll use a report, similar to the one created in the following tutorial: Change or Apply Data Grouping to a Report.
To add page numbers for groups, do the following.
1.From the Toolbox, drop the Page Info control onto the Group Footer.
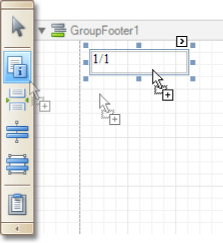
2.Then, select the control, and set its Running Band to GroupHeader1.
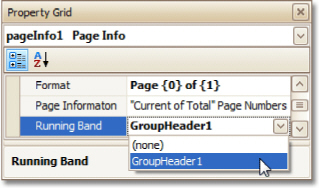
If required, you also can specify its Format property (e.g. Page {0} of {1}).
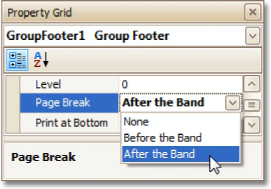
3.Now, you should force each new group to start on a separate page. Otherwise, group page numbers will be calculated incorrectly.
To do this, select the Group Footer, and set its Page Break to After the Band.
4.Finally, select the Group Footer, and click its Smart Tag. In its actions list, check the Repeat Every Page option.
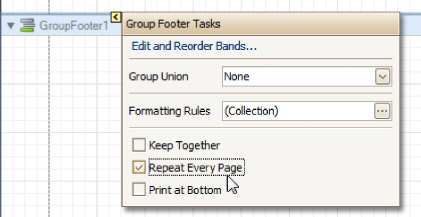
Then, you can do the same for the Group Header, as well.
The report is now ready. Switch to the Preview Tab, and view the result.
See Also
Sort Groups by a Summary Function Result
Count the Number of Records in a Report or a Group
Cancel Printing If a Report Does Not Contain Any Records
Limit the Number of Records per Page
Sort Groups by a Summary Function Result
This tutorial demonstrates how to sort groups based on the result of a function summary specified for them. To demonstrate this feature, we'll use a report similar to the one created in the following tutorial: Change or Apply Data Grouping to a Report.
To sort groups by a summary function result, do the following.
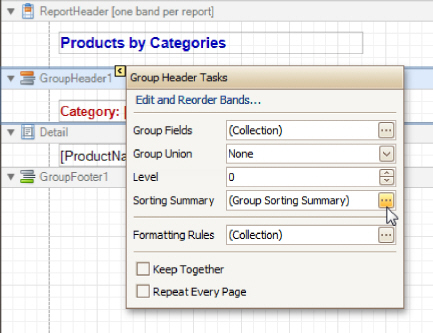
1.Select the Group Header band and click its Smart Tag. In the invoked actions list, click the ellipsis button for the Sorting Summary option.
2.Then, in the invoked Group Sorting Summary Editor, check the Enabled option, and specify a field and summary function against which the group should be sorted.
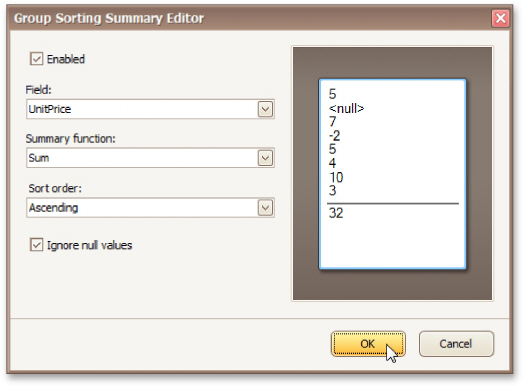
If required, you also can change the default sorting order (from descending to ascending), and choose to ignore null values.
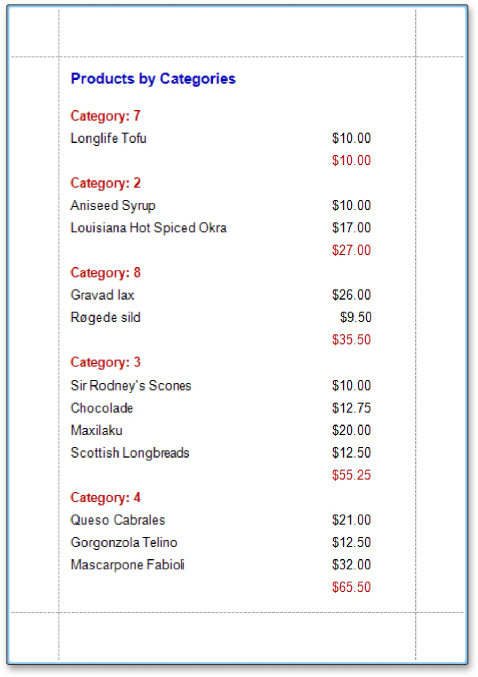
Click OK to apply the changes, and switch to the Preview Tab to view the result.
See Also
Change or Apply Data Grouping to a Report
Count the Number of Records in a Report or a Group
Cancel Printing If a Report Does Not Contain Any Records
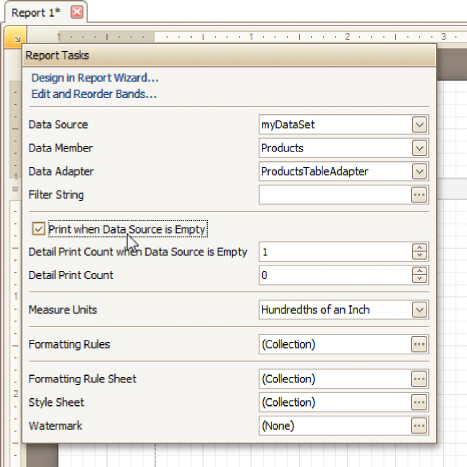
To cancel printing when a report does not contain any records, simply set the report's Print when Data Source is Empty property to No.
You can quickly perform this via the report's Smart Tag.
See Also
Count the Number of Records in a Report or a Group
Limit the Number of Records per Page
Limit the Number of Records per Page
This tutorial demonstrates how to define how many records should be displayed at each page in a report's Print Preview. Note that no scripts are required to accomplish this task.
To demonstrate this feature, we'll use a report, similar to the one created in the following tutorial: Change or Apply Data Grouping to a Report.
To limit the number of records per page, do the following.
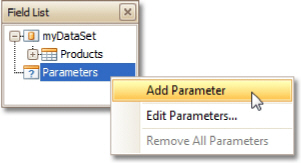
1.To add a parameter to the report, in the Field List, right-click the Parameters section, and in the invoked menu, choose Add Parameter.
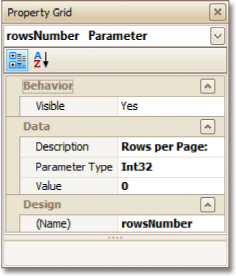
2.Select the parameter, and in the Property Grid, set its Description to Rows per Page:, Parameter Type to Int32 and (Name) to rowsNumber.
3.From the Toolbox, drop the Page Break control onto the top of the report's Detail band.

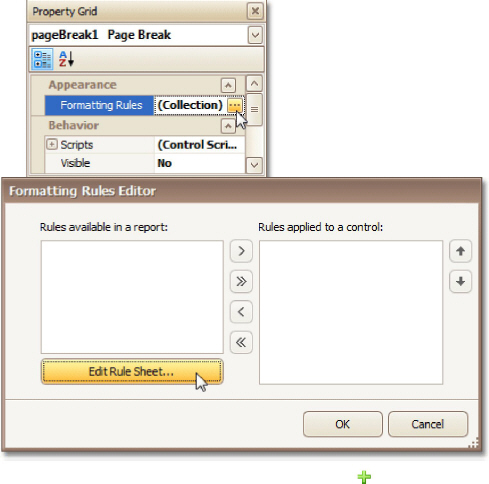
4.Select the Page Break, and set its Visible property to No. Then, click the ellipsis button for its Formatting Rules property, and in the invoked Formatting Rules Editor, click the Edit Rule Sheet... button.
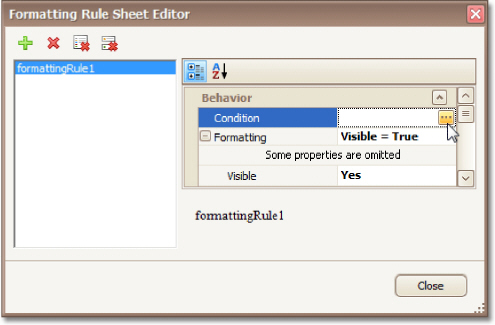
5.Now, in the invoked Formatting Rule Sheet Editor, click , to create a new formatting rule. Set its
Visible property to Yes, and click the ellipsis button for its Condition property.
6.In the invoked Condition Editor, define a logical expression for the rule, (e.g. ([DataSource.
CurrentRowIndex] % [Parameters.rowsNumber] == 0) And ([DataSource.CurrentRowIndex] != 0)).
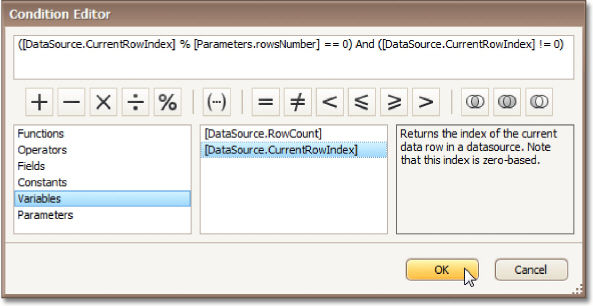
To save the changes and close the dialog, click OK.
Then, click Close, to quit the Formatting Rule Sheet Editor, as well.
7.Now, back in the Formatting Rules Editor, move the created rule to the list of applied rules on the right, using the arrow buttons in the middle of the dialog.
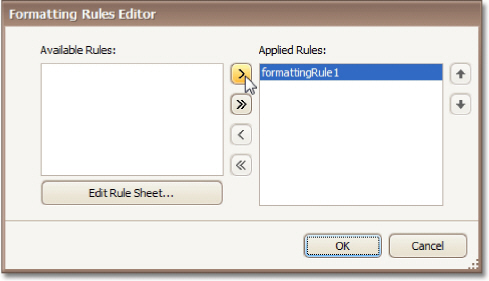
To save the changes and close the editor, click OK.
The report is now ready. Switch to the Preview Tab, and in the Parameters section, define the required value and click Submit.
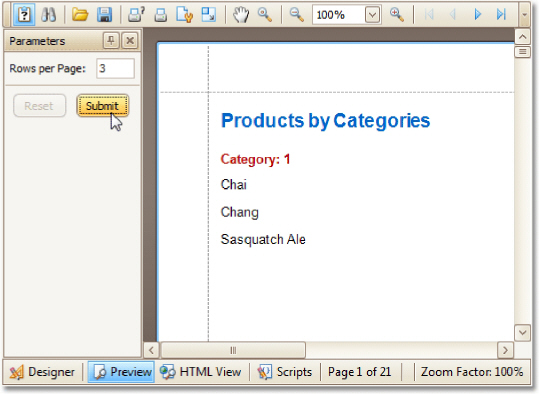
Note that while in this example, the number of rows is specified each time the report is being previewed, you can make this number secure, by setting the parameter's Value option to the desired value, and then setting the report's Request Parameters option to No.
See Also