![]()
In Typical Manger.
• Click New.
• Enter a unique name.
• Optionally, enter a description.
Select the report to remove.
• Click Delete.
• Click OK in the message dialog.
Instead of creating a report from scratch, an existing report can also be copied.
• Select the report to copy.
• Click Copy.
• Enter a new, unique name for the copy.
• Optionally, enter a description.
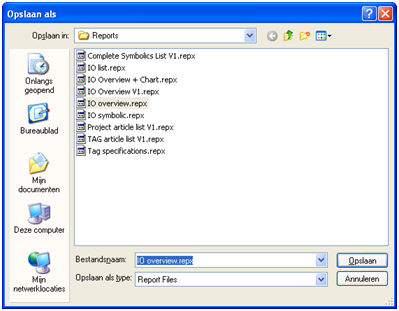
A report can be exported so it can be used in another database.
• Select the report to export.
• Click Export.
• Save as a report file (<name>.repx).
A report can be imported so it can be used in an other database.
• Click Import.
• Select a report file (<name>.repx).
• Optionally, enter a unique name.
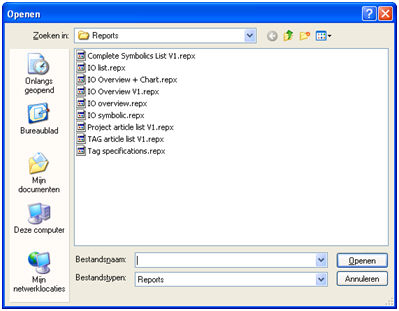
• Optionally, enter a description. See Also
Change Element Layout in Your Report
Sometimes you may need to simply update a couple of values in your report before printing it. In these cases, the simplest way to correct your report is to export it to an editable file (e.g. RTF), then use an appropriate editor tool to edit values and print your report.
To export a report,
switch to the Preview
Tab and click the arrow near the
Export Document... button
![]()
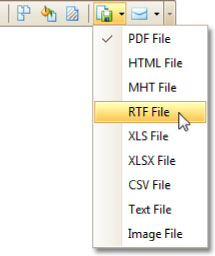
To learn more about report exporting, see Exporting from Print Preview.
Change Element Layout in Your Report
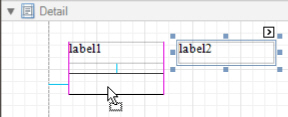
To select a control, simply click it. To select the next control in tab order, press TAB. To select the previous control in tab order, click SHIFT + TAB.
Individual controls can be moved, using either mouse or keyboard.
They can be precisely aligned to each other using either Snap Gird or Snap Lines. For details on this, refer to Controls Positioning.
To resize a control using the mouse, select it, and then drag a rectangle drawn on its edge or corner.
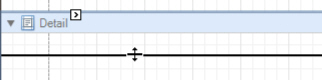
To resize a band, drag its header strip.
To resize an element using the keyboard, press SHIFT+ARROW or CTRL+SHIFT+ARROW.
To select multiple elements, do one of the following.
Click elements while holding CTRL or SHIFT.
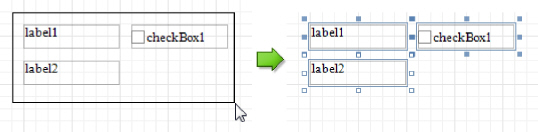
Click on a blank space and drag the mouse to create a selection frame. When the mouse button is released, all controls within the selection frame's boundaries will be selected. In this case, the previous selection is cleared.
You can also easily align multiple controls or make them the same size, by utilizing the Layout Toolbar.
In addition, to copy, paste and delete controls simultaneously, you can place them within the Panel.
For more information, refer to Controls Positioning.
See Also
Change Fonts and Colors of Report Elements
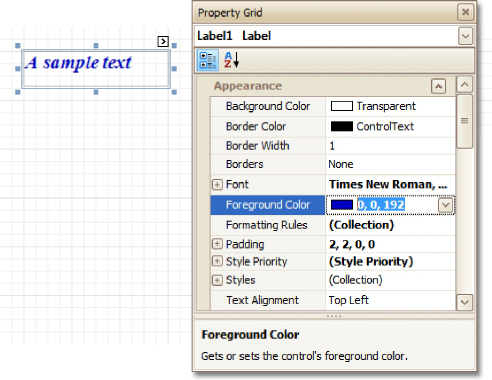
Change Fonts and Colors of Report Elements
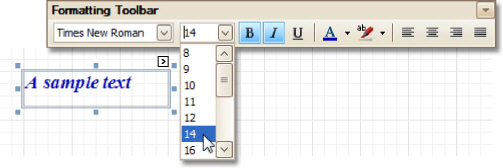
To change fonts and colors (as well as paddings, text alignment and other appearance properties) of a report control or band, select this element and do one of the following.
Use the Formatting Toolbar.
Use the Property Grid, where all appearance-related properties are located under the Appearance category.
Note that the appearance settings of a band are applied to all controls contained within it.
When it's required
to apply styles in bulk, we recommend using common style templates, which
also can be stored in an external style sheet file, and applied to
multiple reports. In addition, this allows you specify separate odd/
even styles, to improve your reports' readability. Another noteworthy option,
is the capability to conditionally change the appearance of report
elements based on a certain logical expression (e.g. if a control's value
satisfies some rule). For more information, refer to Styles
and Conditional Formatting in Reports.
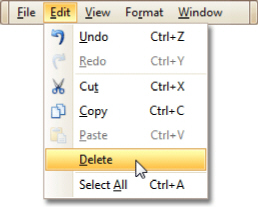
To delete a report element (band or control), select it in the Design Panel or Report Explorer (to select multiple elements, hold down SHIFT while selecting), and then do one of the following.
Press DELETE.
Right-click the report element, and in the invoked Context Menu, choose Delete.
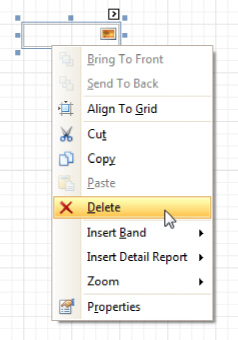
In the Main Menu, select Edit | Delete.
![]() Note
Note
You can cancel the operation by pressing CTRL+Z.
Note that certain elements cannot be deleted (such as the Detail band).
See Also
Change Element Layout in Your Report
Add or Modify Static Information in Your Report
In a report, static and dynamic information is displayed using appropriate controls.
Dynamic information changes through a report, such as values from a database (which comprise the main report data) or service information (such as current user name or page numbers). Approaches to embed dynamic information to your report are detailed in the following document: Display Values from a Database (Bind Report Elements to Data).
Static information is text or images that aren't obtained from a data source, and therefore don't change through the report, and don't depend on the current computer. Static information can be printed only once (e.g. in a Report Header), can repeat on each page (e.g. in a Page Header) or can repeat with every entry in your report's data source (a data-bound label, which is placed onto the Detail band).

Static information can be either edited in-place, or loaded from an external file.
Change Static Information
Text elements (e.g. Labels and Rich Text Boxes) allow in-place editing of their content. Simply double-click an element and activate the editor.
Note: For in-place editing, you also can utilize the Formatting Toolbar.
Another way to change a control's static information, is by clicking its Smart Tag. Then, the invoked actions list will contain a link (or, a button) allowing you to edit this control's content.
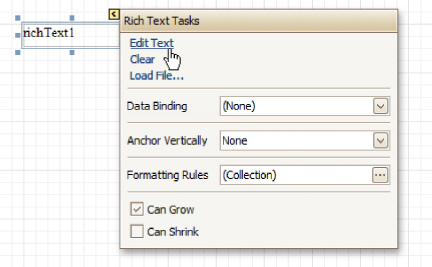
Load Static Information to Your Report
To load static information to your report from an external file, drop an appropriate control from the Control Toolbox (e.g. Label, Rich Text Box or Picture Box). After it is properly positioned, edit its content using the Smart Tag.
For instance, the following instructions describe how to display a rich text (a formatted text with embedded images) into your report.
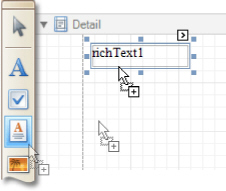
1.Drop the Rich Text control from the Toolbox onto the Detail band.
2.To load content from an external RTF or TXT file, select the created control and click its Smart Tag. In the invoked actions list, click the Load File... link.
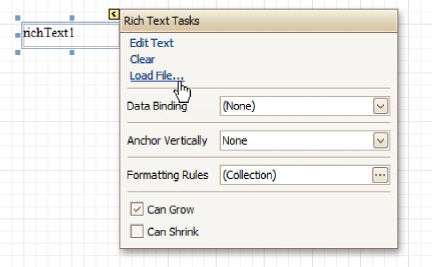
Then, in the invoked dialog, locate the required
file, and click Open.
See Also
Change Fonts and Colors of Report Elements
Display Values from a Database (Bind Report Elements to Data)
Use Mail Merge in Report Elements
Display Values from a Database (Bind Report Elements to Data)
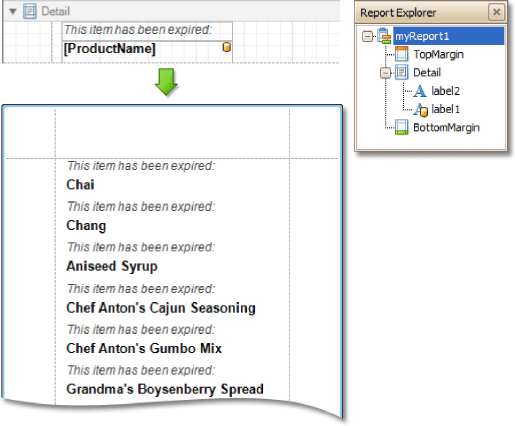
Report controls can either display static information or dynamic data fetched from the bound database.
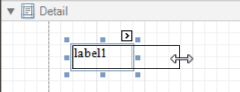
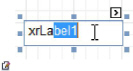
Data-bound controls are indicated by a yellow database icon in their top-right corner, both in the Design Panel and Report Explorer.
To embed dynamic information to a report, if this information is contained in the report's data source, this can easily be done using one of the following approaches.
Using the Field List
Using the Smart Tag
Using the Property Grid
After a control is bound to data, you may wish to employ additional features, which are listed in the final section of this document.
Special Capabilities
Using the Field List
To bind an existing report control to a data field, click the required field item in the Field List, and then drag and drop it onto the control. The yellow database icon inside it will indicate that it's been successfully bound.
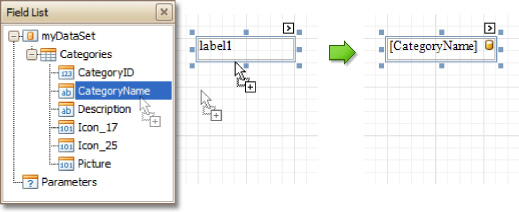
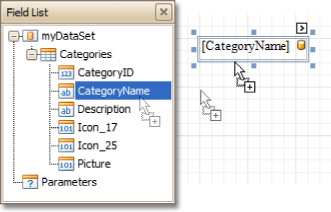
To add a new data-bound control, simply drag the required data field from the Field List onto a report band. This will create a Label bound to this data field.
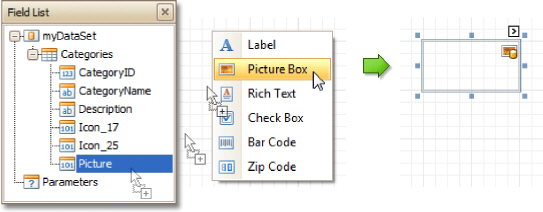
A more flexible way to create data-bound elements is to right-click a Field List item, and then drag and drop it onto a report. This will invoke the Context Menu, where you can choose which control should represent your data, and it will be automatically created and bound to the selected data field.
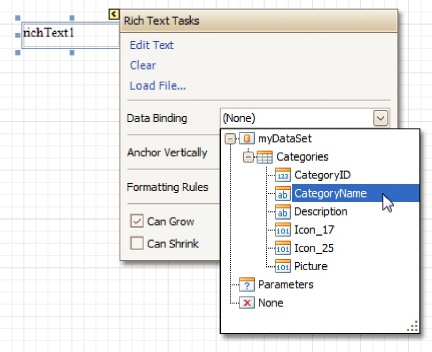
Using the Smart Tag
Click a control's Smart Tag, and in the invoked actions list, expand the Data Binding drop-down list, and select the required data field.
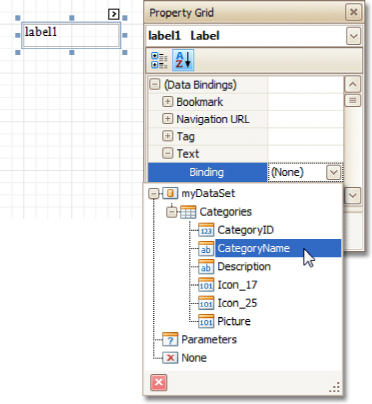
Using the Property Grid
Click a control to select it, and in the Property Grid, expand the (Data Bindings) branch that holds the bindable options. Specify a data field for the required attribute (e.g. Text).
Special Capabilities
After a control is bound, you can apply formatting to its dynamic content (e.g. for it to be treated as currency, or date-time content). For details on this, refer to Change Value Formatting of Report Elements.
It is possible to make a control display a result of a summary function calculated across the data field to which it is bound. For details on this, refer to Add Totals to a Report.
Another noteworthy
option is to combine both static and dynamic content within the same control
(e.g. to append some text prefix or postfix to a value obtained from
a database), or even bind a control to multiple data fields at
one time. This is detailed in Use
Mail Merge in Report Elements.
If it's required to perform some pre-calculations over the data field to which a control is bound, this can be done by creating a calculated field, and binding the control to it. This is detailed at Add Calculated Fields to a Report.
In turn, a calculated field may contain both dynamic and static parameters, which can be requested each time a report is being previewed. For more information, refer to Add Parameters to a Report.
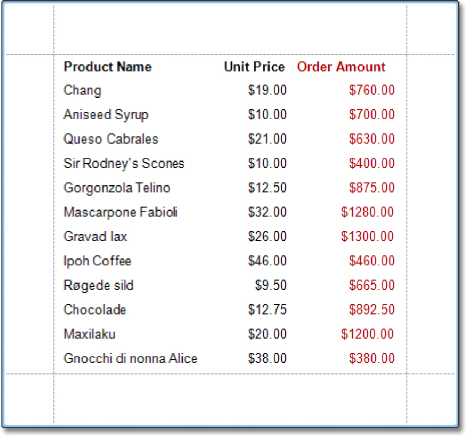
Example. If you want values of two specific attributes for each tag you have in a project, your report will look like this:
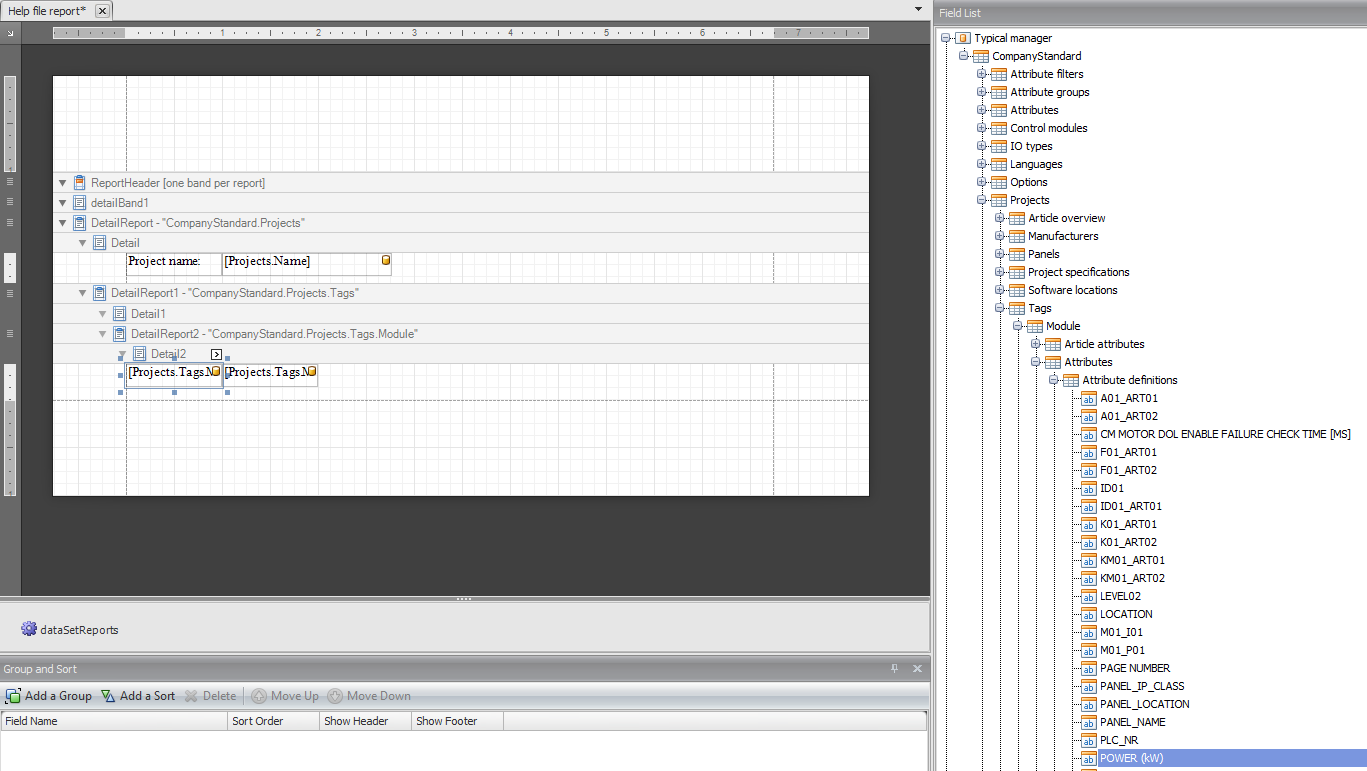
As you can see in the tree view, all attributes you have defined in your library are directly available under 'Attribute definitions'. Normally you need to go down in your report to the same level as you want retrieve data of. For an example, if you want tag data in your report, you need to go down to report band 'CompanyStandard.Project.Tags' (or lower). But with attribute fields this is different. If you want attribute data on 'CompanyStandard.Project.Tags.Module' level, you can drag and drop attributes from the tree on this level of the report. Automatically an attribute field is created. In this way, you can easily get the correct data you want of a module without filtering on attributes. You just can choose the attribute you want and place it on the report.
Other levels where you can choose attribute definitions (attribute fields):
An attribute field has the following properties:
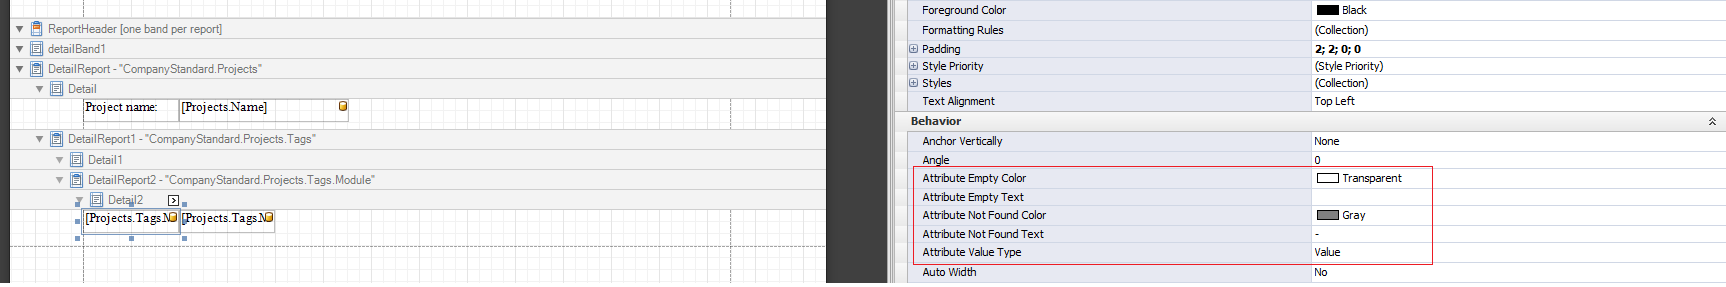
You can set:
Which color this field gets when the attribute is empty.
Which text this field gets when the attribute is empty.
Which color this fields gets when the attribute is not found (e.g. in the module).
Which text this field gets when the attributes is not found (e.g. in the module).
Which value type of the attribute this field must show. The following value types are available:
Name.
Value.
Type.
Link source.
Link path.
Link description.
IsTarget.
IsSource.
Group.
Expression.
Variable.
Use Mail Merge in Report Elements
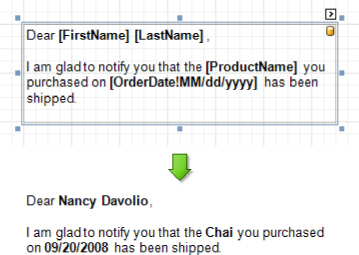
The mail merge feature allows you to combine both static and dynamic content within the same control (e.g. to append some text prefix or postfix to a value obtained from a database), or even bind a control to multiple data fields at one time.
Mail merge is available for the following controls.
To embed dynamic data into a control's static content, type in data field names surrounded by [square brackets].
To learn how values formatting can be applied to the embedded data fields (e.g. for them to be treated as currency, or date-time content), refer to Change Value Formatting of Report Elements.
Add Calculated Fields to a Report
This document demonstrates how to add a calculated field to a report. The main purpose of calculated fields is to perform pre-calculations (of virtually any level of complexity) over data fields. To learn how to easily perform simple calculations within a single data field, refer to Add Totals to a Report.
In the Report Designer, a calculated field is similar to an ordinary data field (e.g. you can bind controls to it, and group, sort and filter your report against it).
To add a calculated field to your report, follow the instructions below.
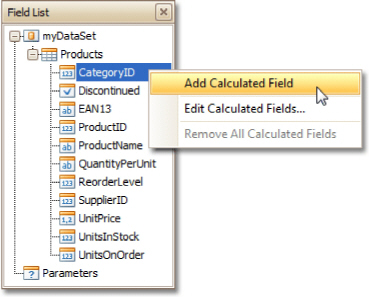
1.To create a calculated field, in the Field List, right-click any data member, and on the invoked menu, choose Add Calculated Field.
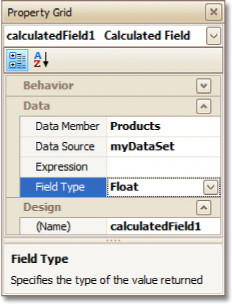
2.In the Field List, select the created field to show its properties in the Property Grid. Among these options, make sure to change the Field Type property to an appropriate value.
3.Now, let's create an expression for the calculated field.
Click the ellipsis button in the Expression section, to invoke the Expression Editor. You can also invoke this dialog by right-clicking your calculated field within the Field List and selecting Edit Expression...
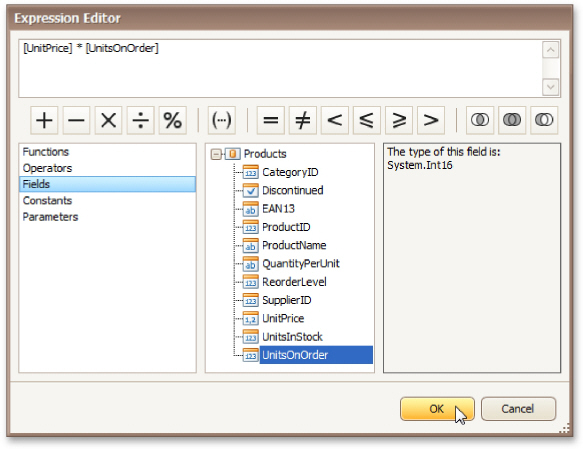
Click Fields
to see the field list. Double-click field
names to add them to the expression string. Use the toolbar to add
operators between field names.
![]() Note
Note
Note that it's also possible to employ parameters in a calculated field's expression.
To close the dialog and save the expression, click OK.
4.Finally, drag the calculated field from the Field List onto the required band, just like an ordinary data field.
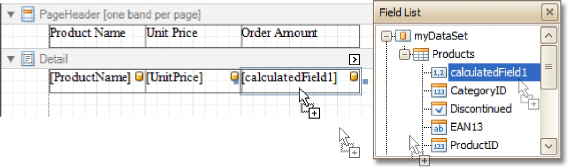
The report with a calculated field is now ready. Switch to the Preview Tab, and view the result.
See Also
Change or Apply Data Filtering to a Report
Change or Apply Data Grouping to a Report
Change or Apply Data Sorting to a Report
For your report, you can employ parameters, which can be requested each time the report is being previewed. And, based on specified values, the report will then being filtered. It's also possible to employ parameters in expressions of calculated fields.
In this example, we'll create two date-time parameters, to filter out orders which don't fall in the specified range, from the report.
To add parameters and filter your report based on their values, follow the steps below.
1.In the Field List window, right-click over the Parameters section and in the invoked menu, click Add Parameter.
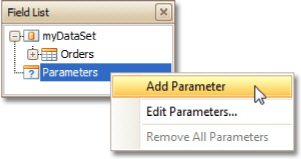
Repeat this action to create the second parameter.
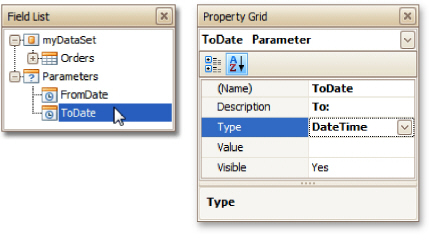
2.In the Field List, select the first parameter, and in the Property Grid, set its (Name) and Description. And make sure to set its Type to an appropriate value.
Then, repeat this step for the second parameter.
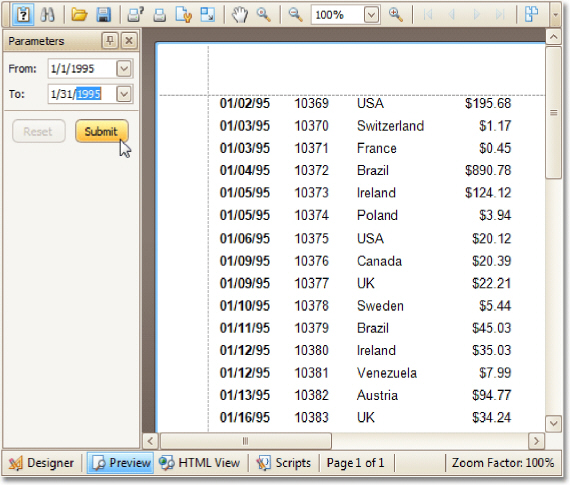
Now, every time your report is previewed, you
will be asked to specify two dates.
![]() Note
Note
In Print Preview, if a report's Request Parameters option is set to Yes, its document is not generated until you have submitted values of all visible parameters via the Parameters UI.
The following instructions explain how to use parameters to filter your report's data.
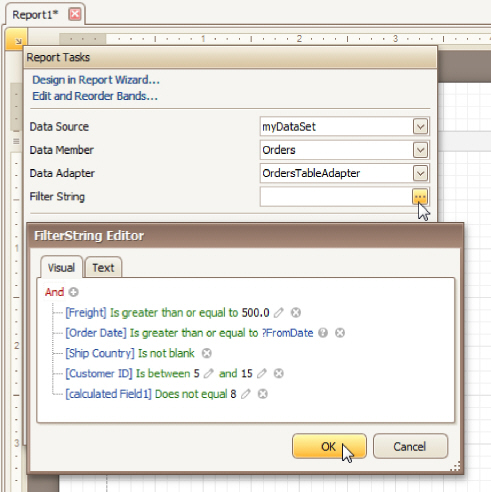
3.Click your report's
Smart
Tag, and in the invoked actions
list, click the ellipsis button for the Filter
String entry. Then, in the invoked
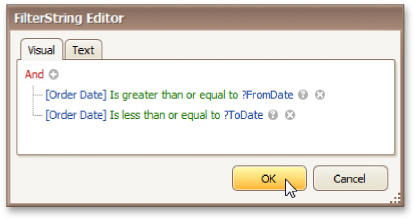
Filter String Editor,
construct an expression where a data field is compared with the created
parameters. To access parameters, click the icon on the right until it
turns into a
question mark.
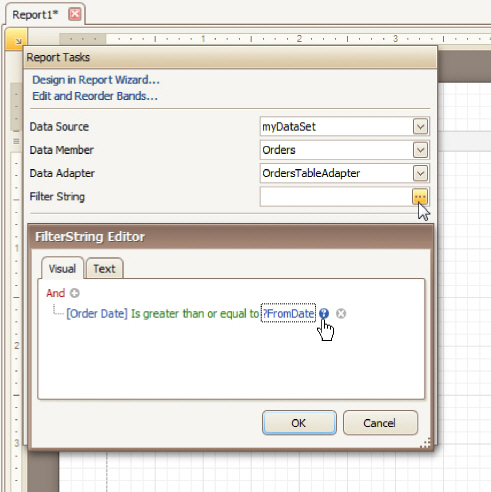
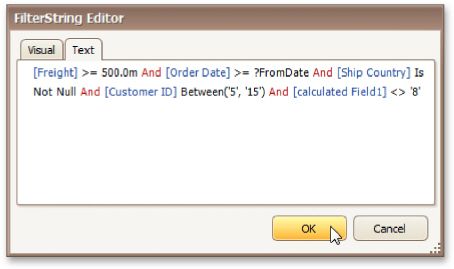
The complete filtering expression will then look like this.
The parameterized report is now ready. Switch to the Preview Tab, and in the Parameters section, define the required values and click Submit.
See Also
Add Calculated Fields to a Report
Change or Apply Data Filtering to a Report
Change Value Formatting of Report Elements
To apply value formatting for a data-bound control's content (e.g. for it to be treated as currency, or date-time content), locate this control, click its Smart Tag, and in the invoked actions list, click the ellipsis button for the Format String entry.
Then, in the invoked format string editor, choose one of the predefined formatting styles, or specify a custom one.
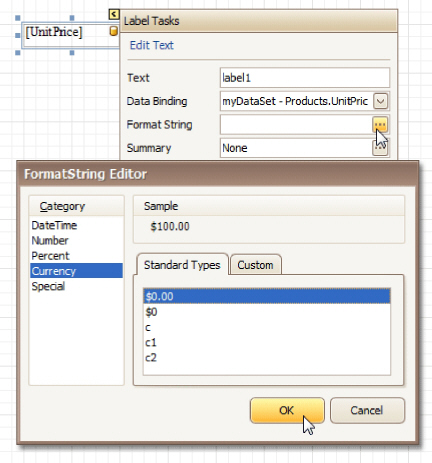
To quit the dialog and apply the changes, click OK.
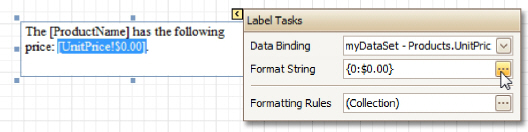
Similarly, when the mail-merge is employed for a control's dynamic content, to apply a value formatting to an embedded data field, select it in the in-place editor, and click the control's Smart Tag. Then, in the invoked actions list, specify the required format.
Note that when a summary function is being applied to a control's dynamic content, value formatting is applied separately, via the Summary Editor, as described at Add Totals to a Report.
Independently from the general (or, summary) value formatting, you can specify a native XLSX format string, which is to be preserved when the report is being exported to XLSX. This can be done via a control's Xlsx Format String property.
Change or Apply Data Sorting to a Report
This document demonstrates how to sort a report's data. Note that as with data grouping, sorting can be performed only if a report is bound to a data source. In this example, we'll use the report created in the following tutorial: Change or Apply Data Grouping to a Report.
To sort records in a data-aware report, do the following.
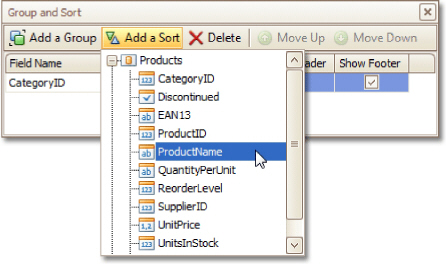
1.Switch to the Group and Sort Panel, and click Add a Sort. In the invoked list, choose a data member across which the report is to be sorted.
Note that sorting across calculated fields is
supported, as well.
2.To manage the sorting order (ascending or descending), use the Sort Order drop-down list.
And, if multiple sorting criteria are specified, you can define the priority for each one, by selecting it in the Group and Sort Panel, and using the Move Up and Move Down buttons.
The sorting is now applied. Switch to the Preview Tab, and view the result.
See Also
Change or Apply Data Grouping to a Report
Change or Apply Data Filtering to a Report
Add Calculated Fields to a Report
Sort Groups by a Summary Function Result
Change or Apply Data Filtering to a Report
For your report, you can specify a filtering expression (of virtually any level of complexity), to exclude excessive or undesired data.
To filter a report's data, click its Smart Tag, and in the invoked actions list, click the ellipsis button for the Filter String entry. Then, in the invoked Filter String Editor, construct an expression.
In the Filter String Editor, you can either use the Visual expression builder, or specify the expression in Text.
Note that it is possible to embed parameters into the expression, and also request them each time a report is previewed.
To quit the dialog and save the changes, click OK.
See Also
Change or Apply Data Grouping to a Report
Change or Apply Data Sorting to a Report
Change or Apply Data Grouping to a Report
This document demonstrates how to group a report's data. Note that data grouping can be performed only if a report is bound to a data source.
To group records in a report, do the following.
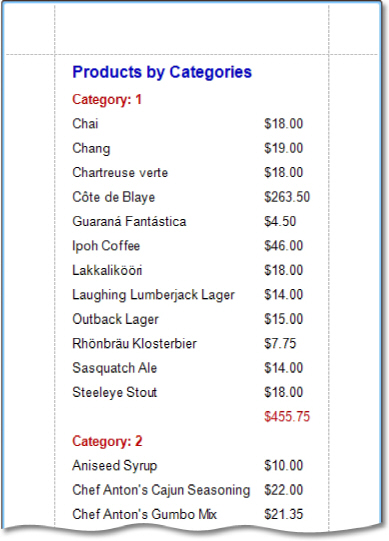
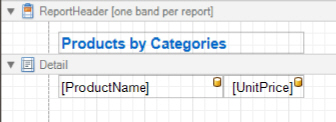
1.Create a new report and bind it to a data source. In this tutorial, we'll start with the following report.
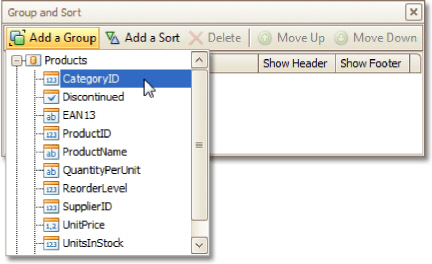
2.Now, switch to the Group and Sort Panel, and click Add a Group. In the invoked list, choose a data member across which the report is to be grouped. Note that grouping across calculated fields is supported, as well.
If multiple groups are created, you can specify
the priority for each group, by selecting it in the Group and Sort
Panel, and using the Move Up
and Move
Down buttons.
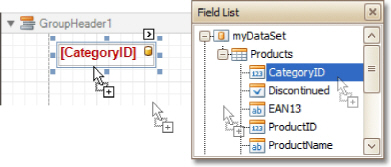
3.After this, a Group Header band is added to the report, with the specified data member being set as its grouping criterion.
Now, it's only left to drop the corresponding item from the Field List onto this band, so that it's displayed as a header for each group.
If required, you also can apply mail merge to this label.
4.In addition, you can enable the corresponding Group Footer band, by checking the Show Footer option in the Group and Sort Panel.
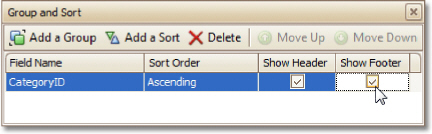
To manage the sorting order of the group's
items (ascending or descending), use the Sort
Order drop-down list.
5.Then, you can calculate a total across the group, by placing a Label onto this band, and specifying its Summary properties in the following way.
Note also that value formatting is applied
to a summary independently of the general formatting,
and has a greater priority.
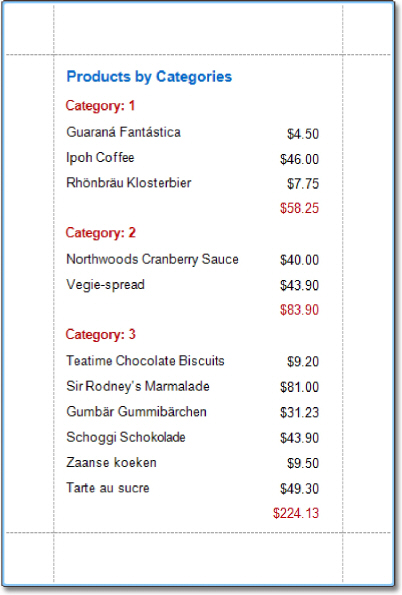
The report is now ready. Switch to the Preview Tab, and view the result.
To learn how groups can be sorted against a summary function result, see Sort Groups by a Summary Function Result.
To learn how page numbers can be added to groups independently from the report's page numbers, refer to Add Page Numbers for Groups.
See Also
Sort Groups by a Summary Function Result
Count the Number of Records in a Report or a Group
Change or Apply Data Sorting to a Report
Change or Apply Data Filtering to a Report
Add Calculated Fields to a Report
With Report Designer, you can force a data-bound control to calculate one of the standard summary functions ( Average, Summary, Count, Running Summary, Percentage, Max or Min).
To calculate summaries (totals) within a report, follow the instructions below.
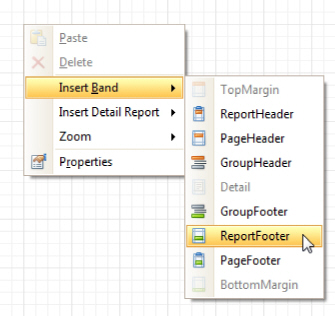
1.To display the result at the bottom of a report, the Report Footer band should be present. To add it, right-click anywhere over the report's area and in the invoked Context Menu, select Insert Band | ReportFooter.
2.Click the field for which a summary will be calculated, to select it. Then, hold down CTRL and drag the field onto the Report Footer area, to create an exact copy of the Label that will display the summary.
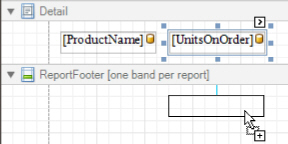
![]() Note
Note
You can also create a new label for your total by simply dragging it from the Control Toolbox.
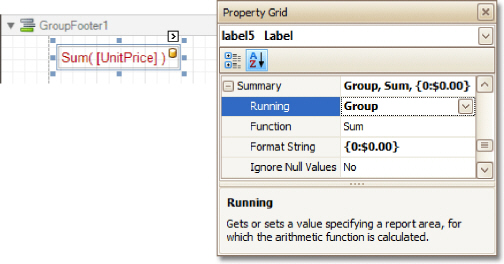
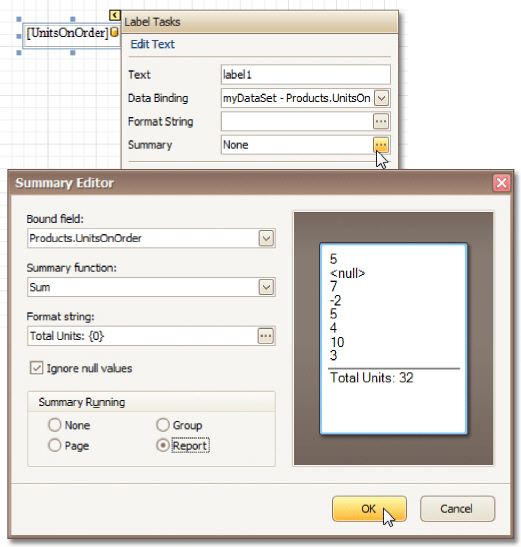
3.Now, select the newly created Label, click its Smart Tag, and in its actions list, click the ellipsis button for the Summary item. And, in the invoked Summary Editor, specify the summary options.
The following image shows an example of how you can set up your total. Note that the Summary Running option is set to Report, to ensure that all values from the specified data field are taken into account.
![]() Note
Note
The Ignore NULL values option won't affect the result in this example, since NULL values are treated like zeros, by default. So, Sum won't change whether these values are taken into account or not. This option makes sense for functions like Count or Average, because the number of elements counted will depend on it.
Note also that value formatting is applied to a summary independently of the general formatting, and has a greater priority.
When calculating
totals for groups, you can sort the groups
against a summary function result.
To save the settings and close the dialog, click OK.
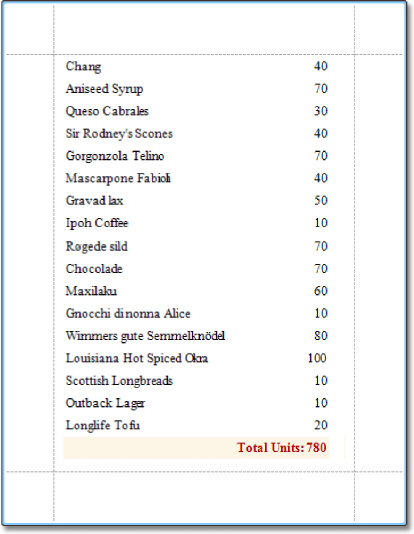
Switch to the Preview Tab, and view the result.
See Also
Change or Apply Data Filtering to a Report
Change or Apply Data Grouping to a Report
Change or Apply Data Sorting to a Report
Sort Groups by a Summary Function Result
Add Page Numbers and System Information to a Report
This document describes how to insert page numbers or other system information (e.g. current date and time, user name, etc.) into a report.
Generally, this information is displayed within the Page Header and Footer or Page Margin bands. To add page numbers or system information to a report, locate the Control Toolbox and drag and drop the Page Info control.
Then, follow the instructions below for your specific task.
Add Page Numbers
Add System Date and Time
Add the User Name
Add Page Numbers
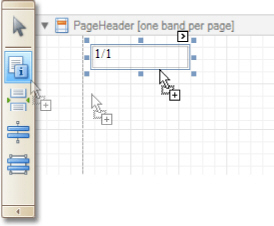
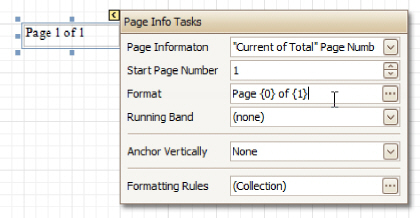
1.Select the Page Info control, click its Smart Tag, and in the invoked actions list, expand the drop-down list for the Page Information entry.
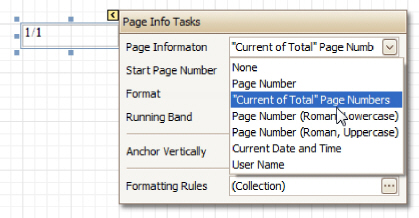
Select whether to display only the page number
(Latin or Roman - uppercase or lowercase), or the current page number
with total pages.
2.To format the control's text, via its Smart Tag, invoked its actions list, and specify the required format (e.g. Page {0} of {1}).
3.Using the control's actions list, you also can specify the starting page number, and the running band (e.g. this option is available when there are groups in a report, and it's required to apply independent page numbering for them). For details on this, refer to Add Page Numbers for Groups.
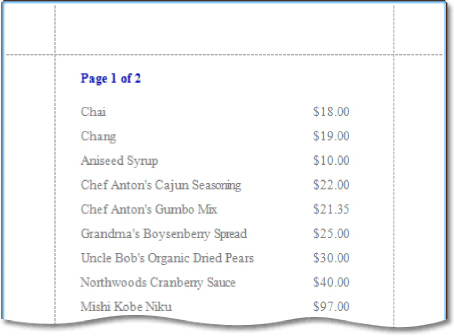
The result is shown below.
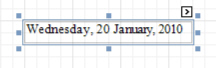
Add System Date and Time
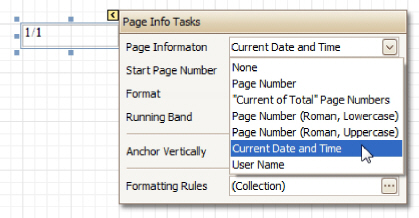
1.Select the Page Info control, click its Smart Tag, and in the invoked actions list, expand the drop-down list for the Page Information entry, and select Current Date and Time.
2.To format the control's text, via its Smart Tag, invoked its actions list, and specify the required format. You can either type it in the Format field, or, click its ellipsis button and use the Format String Editor.
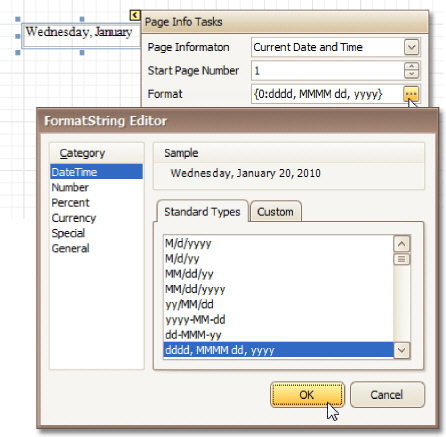
The result is shown below.
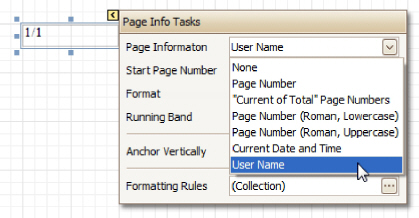
Add the User Name
1.Select the Page Info control, click its Smart Tag, and in the invoked actions list, expand the drop-down list for the Page Information entry, and select User Name.
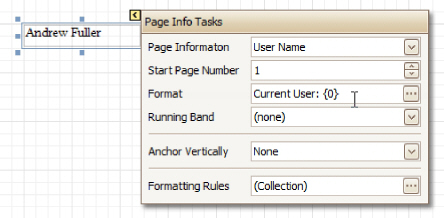
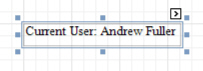
2.To format the control's text, via its Smart Tag, invoke its actions list, and specify the required format (e.g. Current User: {0}).
The result is shown below.
See Also
Create or Modify Watermarks of a Report
Create or Modify Watermarks of a Report
This document describes how to add a text watermark in a report, or turn a picture into a report's background. Note that watermarks are visible only in Preview and HTML View modes.
To create a new watermark in a report (or to modify the existing one), do the following.
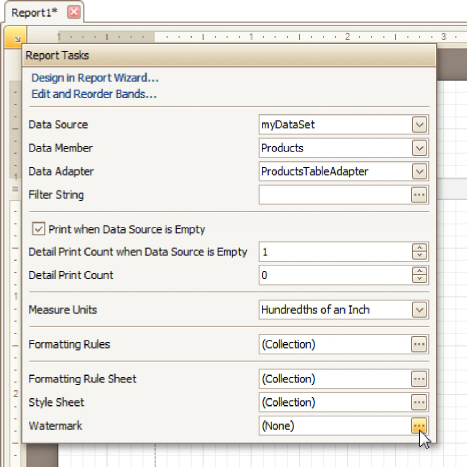
1.Click the report's Smart Tag, and in its actions list, click the ellipsis button for the Watermark entry.
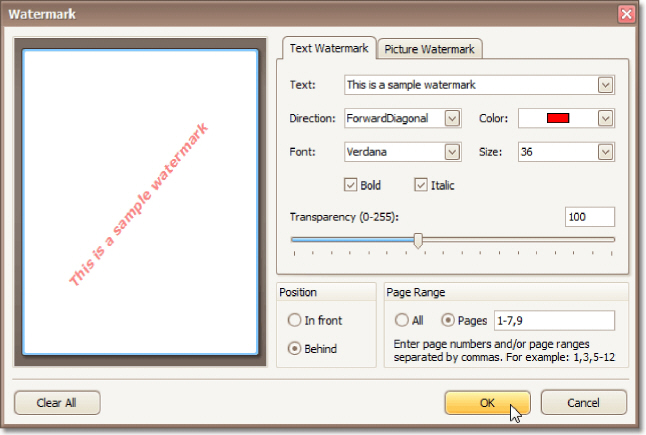
2.In the Text tab of the invoked Watermark dialog, define the required properties for the text watermark.
3.Then, switch to the Picture Watermark tab, to load the image to be used as a watermark, and define its properties, such as Size mode, Alignment (vertical and horizontal), Tiling, Transparency, Page Range, etc.
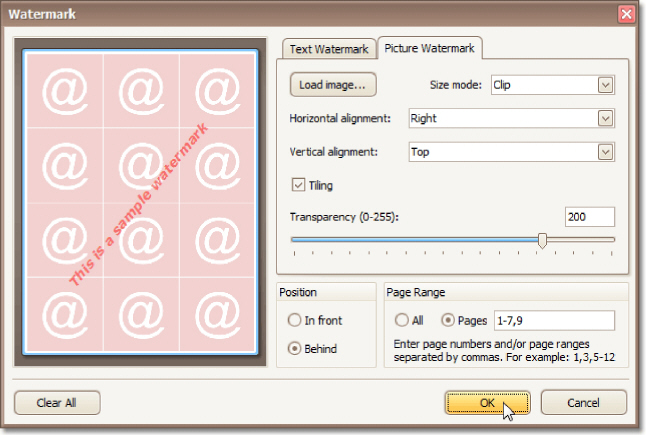
As you can see, it is possible to use both textual and image watermarks simultaneously.
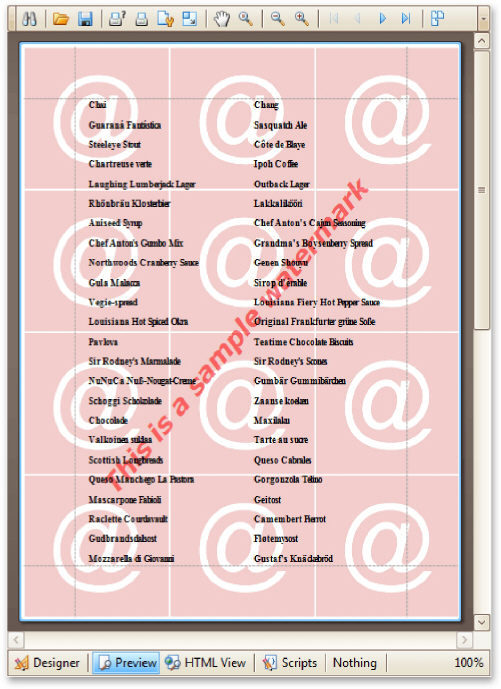
The report with watermark is now ready. Switch to the Preview Tab, and view the result.
See Also