![]()
The Report Wizard allows you to create reports of two kinds - standard reports and label reports. To create a standard report, invoke the Report Wizard dialog and choose the Standard Report option on the Welcome page.
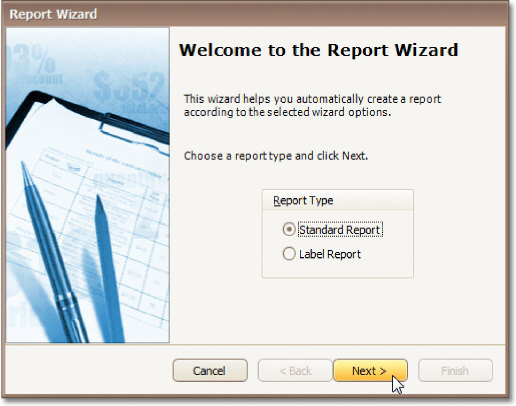
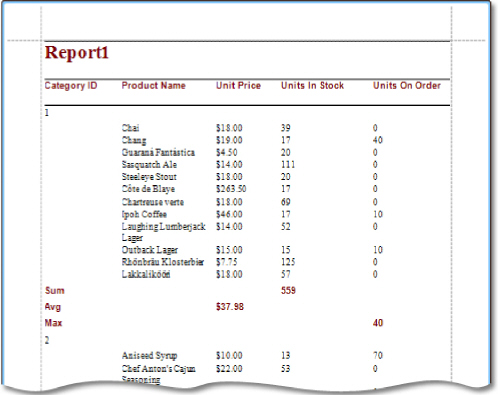
After completing the Standard Report wizard, you will get a tabular banded report. Depending on how many wizard steps you complete (you don't necessarily have to go through all the pages), you can apply data grouping, display totals, select one of the predefined style sheets, etc.
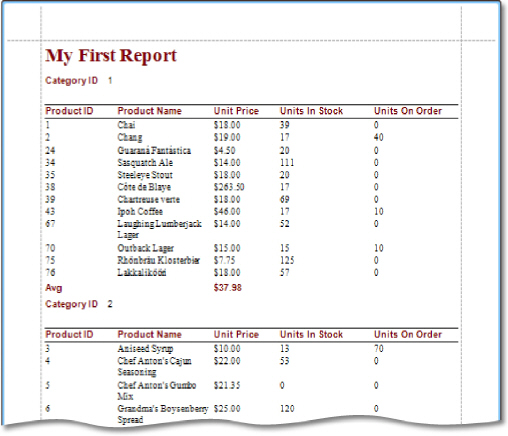
The following image shows a sample report created using the Standard Report Wizard.
Use the links below to learn more about every step of the Standard Report wizard.
![]() Note
Note
Depending on the method you used to invoke the Wizard, you may be creating an entirely new report or modifying an existing one. Creating reports from scratch requires database connection knowledge. In these cases, it's better if you contact your application administrator or vendor for assistance with the first three steps of the wizard. If you're modifying an existing report, you'll skip these initial data binding steps and start with Step 4 - Choose Columns to Display in Your Report.
![]() Note
Note
This wizard step appears only if you're creating a new report from scratch. In this instance, familiarity with database connections is required, so we recommend that you contact your application administrator or vendor for assistance. If you're modifying an existing report, you will skip this step and start with Step 4 - Choose Columns to Display in Your Report.
The first page is intended to set the dataset name, which will be used in the report (e.g. in the Field List).
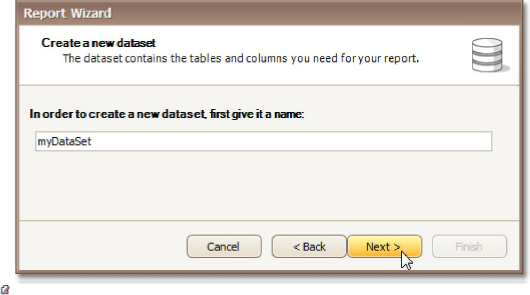
Note: When specifying the dataset name you need to avoid special characters, such as: whitespace, !, #, %, $, ^, &, *, (, ), -, +, =, \, /, etc.
Then, click Next to proceed to Step 2 to select a data connection.
Step 2 - Choose a Data Connection
![]() Note
Note
This wizard step appears only if you're creating a new report from scratch. In this instance, familiarity with database connections is required, so we recommend that you contact your application administrator or vendor for assistance. If you're modifying an existing report, you will skip this step and start with Step 4 - Choose Columns to Display in Your Report.
Purpose
Connect to a database whose data will be shown in your report.
Page Interface
On this page you can either select one of the data connections currently available in the drop-down list, or create a new one. To create a new connection, click the New Connection... button. It invokes a Data Link Properties dialog, allowing you to set up a new database connection.
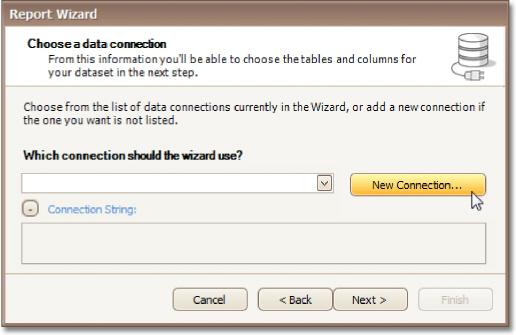
Once a connection has been set up, click Next to proceed to Step 3 - Choose the Table or View.
Step 3 - Choose the Table or View
![]() Note
Note
This wizard step appears only if you're creating a new report from scratch. In this instance, familiarity with database connections is required, so we recommend that you contact your application administrator or vendor for assistance. If you're modifying an existing report, you will skip this step and start with Step 4 - Choose Columns to Display in Your Report.
Purpose
Select a table or a view, whose data will be used in your report.
Page Interface
The list on the left-hand side shows all tables and views available in the database you specified in the previous wizard step. To select a required item, click it and then press the right arrow (>) button.
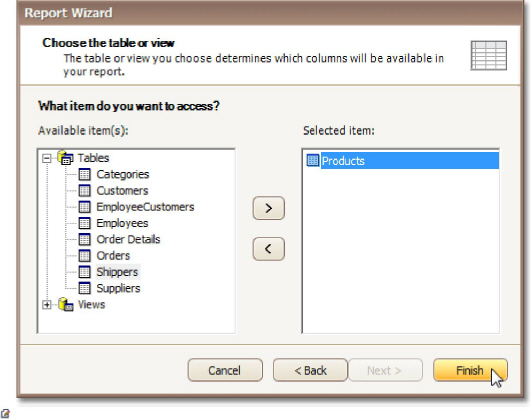
Note: Note that you can select only one table or view to be bound to the report. Therefore, it's impossible to create a master-detail report with this wizard.
Click Next to proceed to Step 4 - Choose Columns to Display in Your Report.
Step 4 - Choose Columns to Display in Your Report
Purpose
Choose fields (attributes) whose data will be displayed in your report. The selected fields and corresponding captions will be automatically added to your report, arranged one under another.
Page Interface
The list on the left-hand side shows all available fields (attributes). To select the required fields, double-click them or drag them to the list box on the right-hand side. Another way to select fields is to use arrow buttons to move them back and forth.
Note that you can move multiple fields at once. To do this, you first need to select them by clicking while holding CTRL or SHIFT, or by using SHIFT+UP ARROW or SHIFT+DOWN ARROW shortcuts.
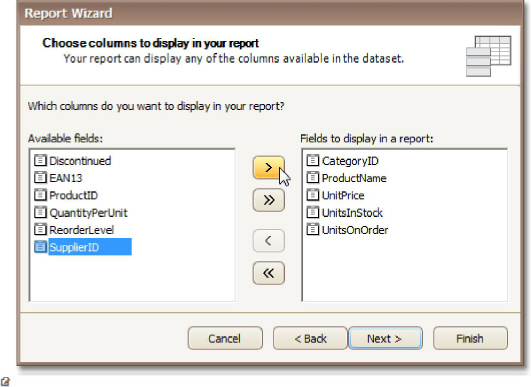
Note: To continue or finish report creation, you must select at least one field.
Result
You can stop the wizard at this step by clicking Finish. In this case, your report will look similar to the image below.
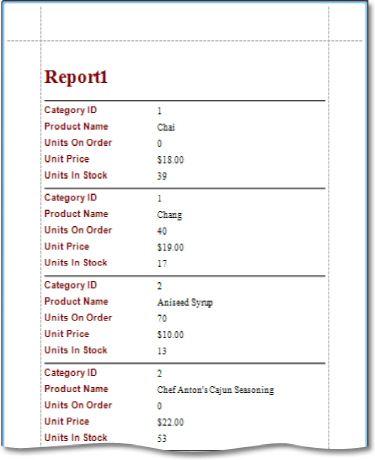
If you want to customize your report further, click Next to proceed to Step 5 - Add Grouping Levels.
Purpose
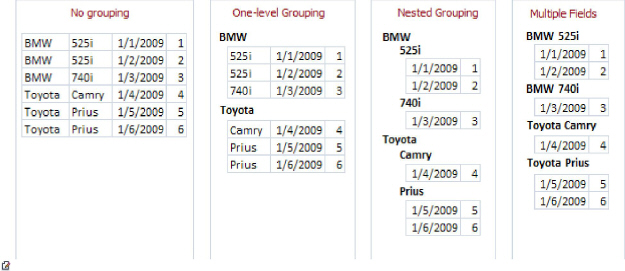
This page allows you to group data in your report. For instance, if you are displaying car sales information, you may want to keep records corresponding to the same model together. Each set of records with the same model will become a "group" with its own header.
Nested grouping and grouping against multiple fields are fully supported. The following image illustrates all basic grouping types.
Note: If you don't need to group your data, simply click Next on this page to skip this step.
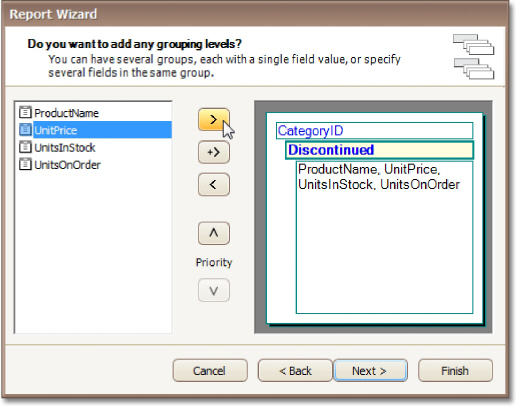
Page Interface
The list on the left-hand side displays data fields that can be used to group data. To apply grouping, do one of the following.
Select columns and click the right arrow (>) button.
Drag required columns to the box on the right-hand side.
Double-click columns.
Note that grouping fields on the right-hand side can be selected by clicking them. This is useful if you need to remove them or change their order. To accomplish the latter, use the up arrow ( ) and down arrow ( ) buttons.
Result
You can stop the wizard on this step by clicking Finish. In this case, your report will look similar to the image below.
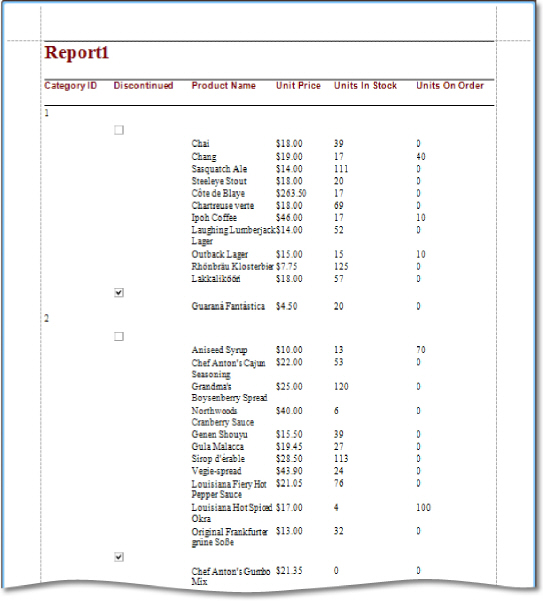
If you want to customize your report further, click Next. If data grouping has been applied on this page, you'll proceed to Step 6 - Summary Options. If you haven't grouped your data, you'll skip the Summaries step and go to Step 7 - Choose Report Layout.
![]() Note
Note
This wizard step is only available if you've applied data grouping in the previous step (Step 5 - Add Grouping Levels). If you haven't grouped data, this step is skipped.
Purpose
Use this page to specify totals to be displayed for each data group and grand totals for the entire report. For instance, you may need to display the sum of values in a particular field, the average value, etc. Specified totals will be displayed after corresponding groups, and in the report footer.
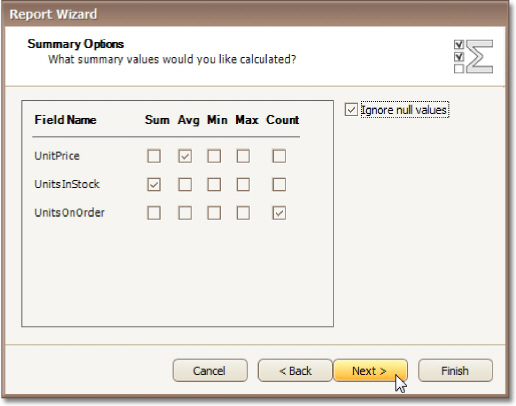
Page Interface
This page displays all available numerical and date-time fields that aren't used to group data. Using the check box table, you can specify which functions should be calculated for these fields.
Sometimes, data fields can contain empty values (this is different from, say, zero in a numeric field). If you don't want to take these values into account when calculating totals, check Ignore NULL values. Otherwise, these values will be treated as zeros for numeric fields and the earliest system date for date-time fields.
Result
You can stop the wizard on this step by clicking Finish. In this case, your report will look similar to the image below.
If you want to customize your report further, click Next to proceed to Step 7 - Choose Report Layout.
Purpose
This page sets the layout of elements in your report. If you haven't applied data grouping, you can specify how data field values are arranged - into a table, one under another, etc. If report data is grouped, you can choose one of the available indentation styles for nested elements.
Additionally, this page allows you to specify the page orientation for your report.
Page Interface
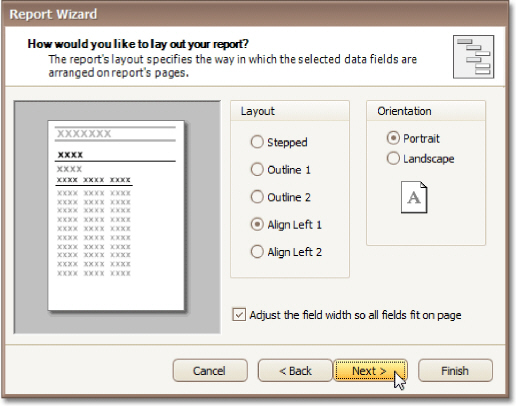
The following options are available if data grouping has been applied.
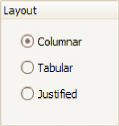
If data hasn't been grouped, you will see the following report layout options.
If you want to customize your report further, click Next to proceed to Step 8 - Choose Report Style. Otherwise, click Finish to complete report customization.
Purpose
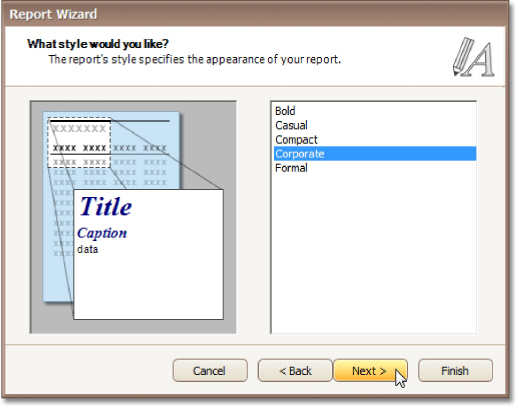
Apply a predefined style sheet to your report.
Page Interface
Select one of the predefined styles from the list box.
If you want to customize your report further, click Next to proceed to Step 9 - Enter a Report Title. Otherwise, click Finish to complete report customization.
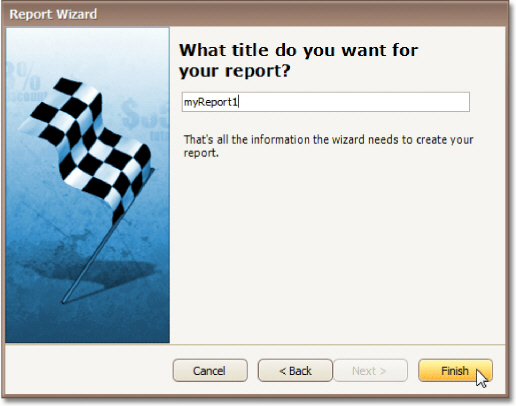
Purpose
Specifies the report title.
Page Interface
Enter a title string into the editor and click Finish to complete report creation.