![]()
| Providing Data |
This topic describes how to bind a Range Filter dashboard item to data in the Dashboard Designer.
The Dashboard Designer allows you to bind various dashboard items to data in a virtually uniform manner (see Binding Dashboard Items to Data for details).
The only difference is in the data sections that these dashboard items have.
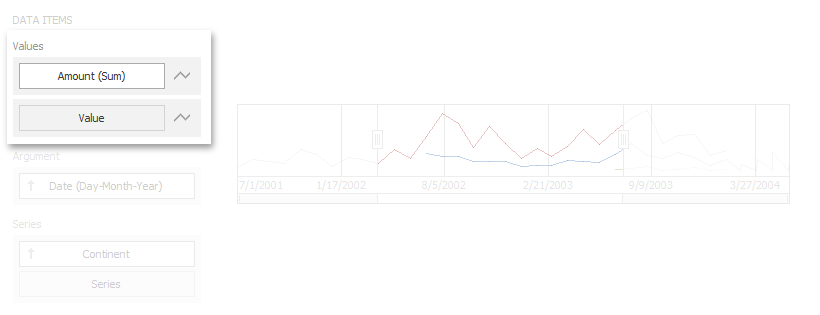
The Values section contains data items for calculating the Y-coordinates of data points.

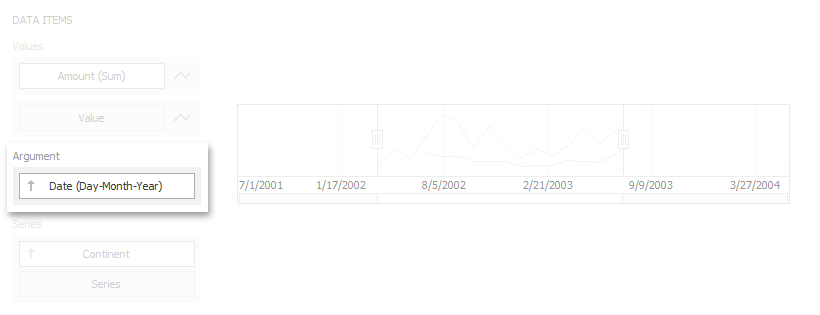
The Arguments section contains data items that provide values displayed along the horizontal axis of the Range Filter. Filtering is performed based on these values.

 Note Note |
|---|
The Range Filter allows only one data item to be added to the Arguments section. |
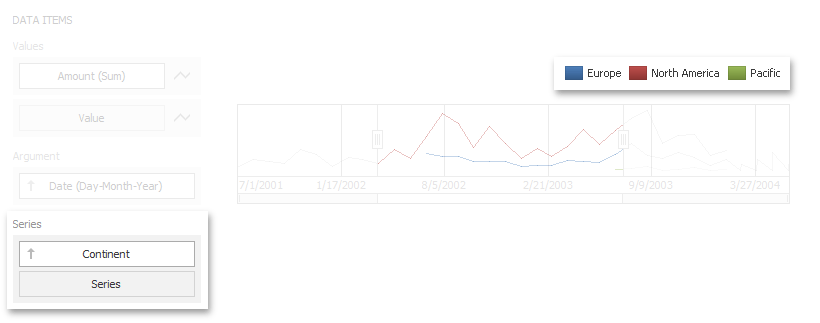
The Series section contains data items whose values are used to create chart series.

 Note Note |
|---|
The legend is displayed in the above screenshot to illustrate a series that has been created from data item values. The Range Filter does not have the capability to show a legend. |