![]()
| Series |
The Chart dashboard item supports a variety of series types - from simple bar and line charts to complex candle stick and bubble graphs.
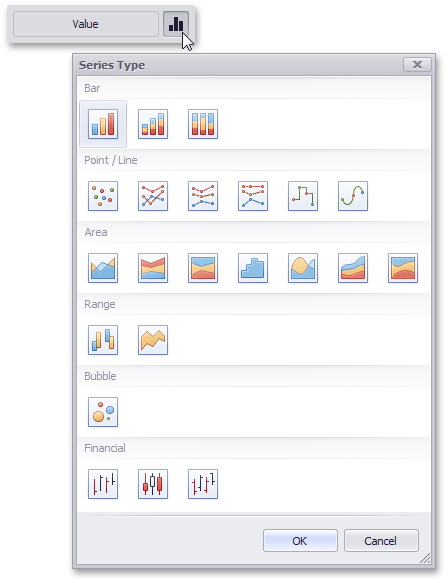
To switch between series types in the Designer, click the options button next to the required data item (or placeholder) in the Values section. In the invoked Series Type dialog, select the required series type and click OK.

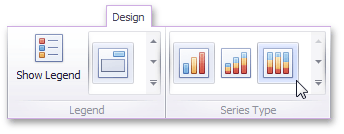
You can also do this using the Series Type gallery in the Design Ribbon tab.

A Bar series displays data as sets of rectangular bars with lengths proportional to the values that they represent.
This topic lists the available Bar series types.
|
|
|
Point and Line series display data as standalone points or points joined by a line.
This topic lists the available Point and Line series types.
|
|
|
|
|
|
An Area series displays data by a line that joins points, and the shaded area between the line and the argument axis.
This topic lists the available Area series types.
|
|
|
|
|
|
|
A Range series is the area between two simple series displayed as a shaded area (Range Area), or bars that stretch from a point in one series to the corresponding point in another series (Range Bar).
This topic lists the available Range series types.
|
|
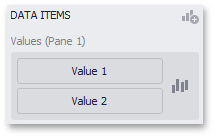
Because a range series represents the area between two simple series, you need to provide two measures instead of one to display a range series.
When you select the Range Bar or Range Area series type in the Designer, the Data Items area displays two data item placeholders.

A Weighted series displays data using a third dimension, expressed by a bubble's size.
This topic lists the available Weighted series types.
|
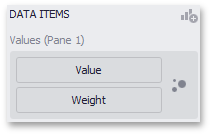
Data points in a weighted series present the following two measures:
When you select the Bubble series type in the Designer, the Data Items area displays two data item placeholders.

Financial series are useful in analyzing stock and bond prices, as well as the behavior of commodities.
This topic lists the available Financial series types.
Data Binding: Data points in a High-Low-Close series present three measures.
When you select the High-Low-Close series type in the Designer, the Data Items area displays three data item placeholders.
|
Data Binding: Data points in a High-Low-Close series present four measures.
When you select the Open-High-Low-Close series type in the Designer, the Data Items area displays four data item placeholders.
|
Data Binding: Data points in a High-Low-Close series present four measures.
When you select the Open-High-Low-Close series type in the Designer, the Data Items area displays four data item placeholders.
|