![]()
| Columns |
The topics in this section describe the different types of grid columns, and contain information on when to use each column type and how to customize them based on the type.
The Grid dashboard item supports four types of columns.
Displays values in the bound data item "as is".
Displays summaries calculated against data in the bound data item.
Bound to two measures, it calculates summaries for both measures, and displays the difference between these summaries.
Displays values in the bound data item using sparklines.

When you drop a data item into the Columns section, the type for the new column is determined automatically, based on the data type.
The type of the column is indicated within the corresponding data item container in the DATA ITEMS area.
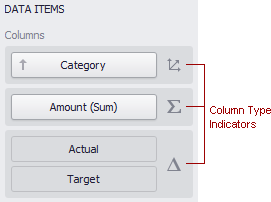
Column type indicators are defined as follows:
To change the column type, click the column type indicator. In the invoked Column Options window, select the required column type in the Column type section.
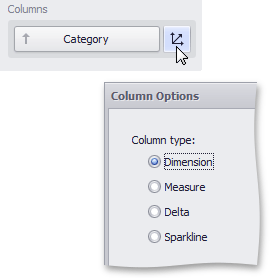
The dimension column displays values from the bound data item "as is".

If the dimension column is bound to a data source containing images, it can display images.
A measure column displays summaries calculated against data in a bound data item.

Values in the measure column can be displayed as text or represented by bars.

To select between these modes, invoke the Column Options window and select Value or Bar.
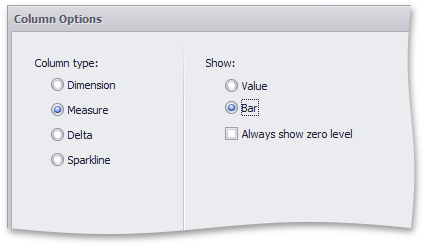
If bars are displayed, use the Always show zero level check box to specify whether the bar's zero level is always visible.
A delta column calculates summaries against two measures, and displays the difference between these summaries. This difference can be indicated with a numeric value displayed within the delta element and an additional delta indication.
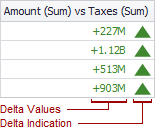
Delta columns are bound to two measures that provide two values: the Actual value and the Target value. The difference between these values is displayed in the column.
When you switch the column type to Delta, the data item container is changed, to accept the Actual and Target measures.
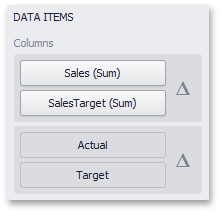
Values in the delta column can be displayed as text, or represented by bars.

To select between these modes, invoke the Column Options window and select Value or Bar.
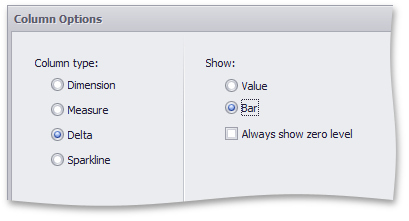
If bars are displayed, use the Always show zero level check box to specify whether the bar's minimum value is zero (checked) or an automatically selected value that ensures that the difference between bars is clearly displayed (unchecked).

If the display type is set to Value, the Column Options window displays options that allow you to configure delta values and indication.
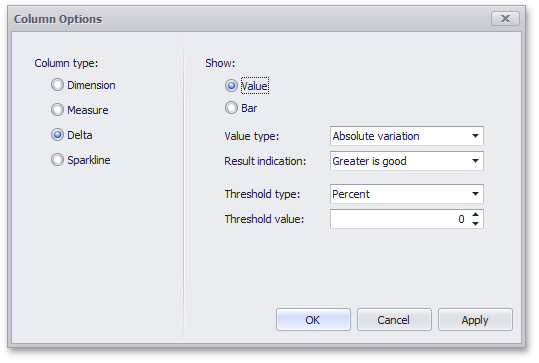
You can specify which values should be displayed in the delta column. To do this, use the Value type combo box in the Column Options window.
Actual value |
Absolute variation |
Percent variation |
Percent of target |
|---|---|---|---|
 |
 |
 |
 |
To specify the condition for displaying delta indication, use the Result indication combo box in the Column Options window.
Greater is good |
Less is good |
Warning if greater |
Warning if less |
No indication |
|---|---|---|---|---|
 |
 |
 |
 |

|
The comparison tolerance allows you to specify more advanced conditions for displaying delta indication. For instance, you can set a specific indication to be displayed when the actual value exceeds the target value by 10% or by $2K.
Use the Threshold type combo box to select whether you wish to specify the comparison tolerance in percentage values or in absolute values. Then use the Threshold value box to specify the comparison tolerance.

A sparkline column visualizes the variation in summary values over time.

The sparkline column is bound to a measure providing sparkline values and to a dimension providing a date-time interval.
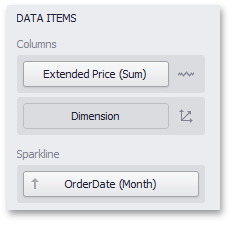
You can control sparkline appearance settings using the
Column Options dialog. To invoke this dialog, click
the column type indicator ( ).
).
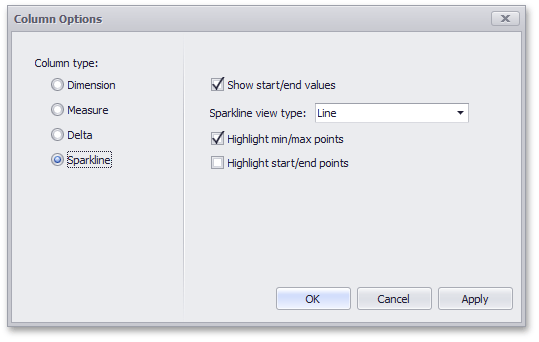
In this dialog, you can control various settings that affect how the sparkline is displayed within a grid cell.

Sparkline Options |
Description |
|---|---|
| Show start/end values | Species whether or not to display sparkline start/end values within a grid cell. |
| Sparkline view type | Defines the view type of a sparkline. Sparkline view types include Line, Area, Bar, and Win/Loss. |
| Highlight min/max points | Specifies whether or not to highlight the minimum/maximum points of a sparkline. |
| Highlight start/end points | Specifies whether or not to highlight the start/end points of a sparkline. |