![]()
| Axes |
The X-axis is the axis of arguments.
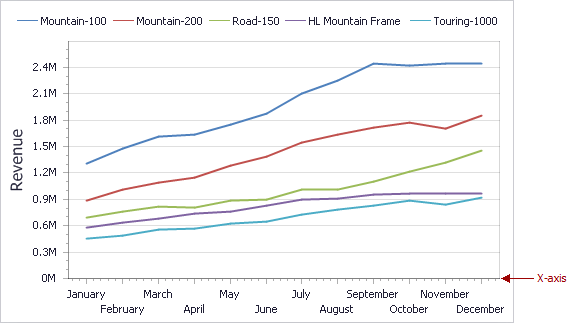
This topic consists of the following sections.
To access the X-axis settings, use the X-Axis Settings button in the Diagram group of the Design Ribbon tab.
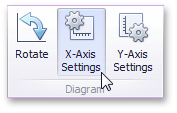
This will invoke the X-Axis Settings dialog.
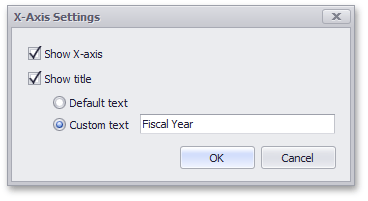
This dialog contains the following settings.
| Show X-axis | Allows you to hide and show the X-axis. |
| Show title | Allows you to hide and show the X-axis title. You can choose whether to use the default text or specify a custom string. |
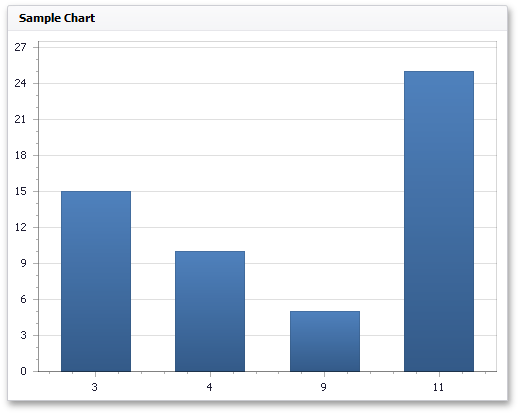
If the dimension in the Arguments section contains numeric data, the Chart can create either a continuous X-axis or a discrete X-axis.
If a continuous axis is used, the distance between argument values is proportional to their values.
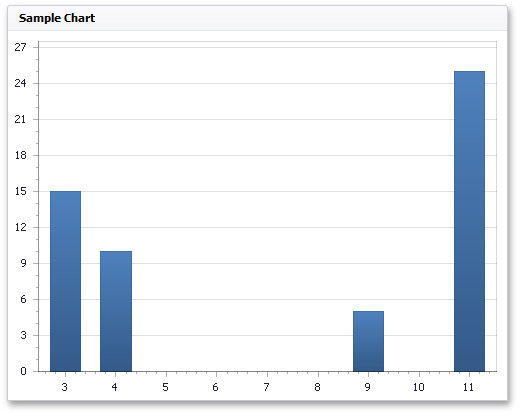
On a discrete axis, all argument values are an equal distance from each other.
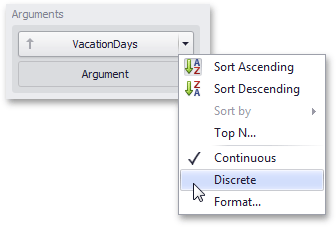
To specify the X-axis type in the Designer, invoke the data item menu for the argument dimension and select the axis type.
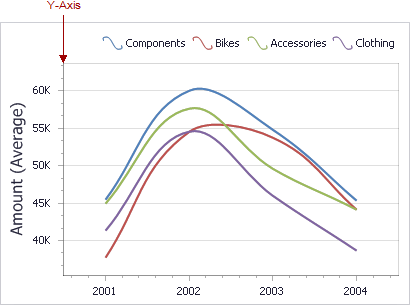
The Y-axis is the numerical axis of values.
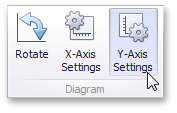
To access the Y-axis settings, use the Y-Axis Settings button in the Diagram section of the Design Ribbon tab.
This will invoke the Y-Axis Settings dialog.
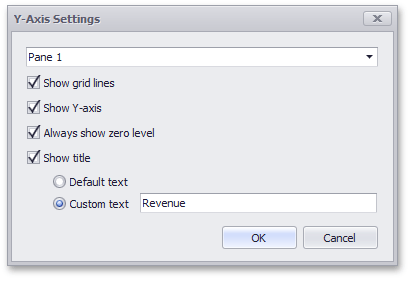
Use the combo box at the top to select the pane for the Y-axis settings you need to edit.
The dialog contains the following settings.
| Show grid lines | Allows you to hide and show grid lines for the Y-axis. |
| Show Y-axis | Allows you to hide and show the Y-axis. |
| Always show zero level | Specifies whether or not the axis' zero level is visible. If this option is unchecked, the visible axis range is defined based on the values plotted in the chart. |
| Show title | Allows you to hide and show the Y-axis title. You can choose whether to use the default text or specify a custom string. |